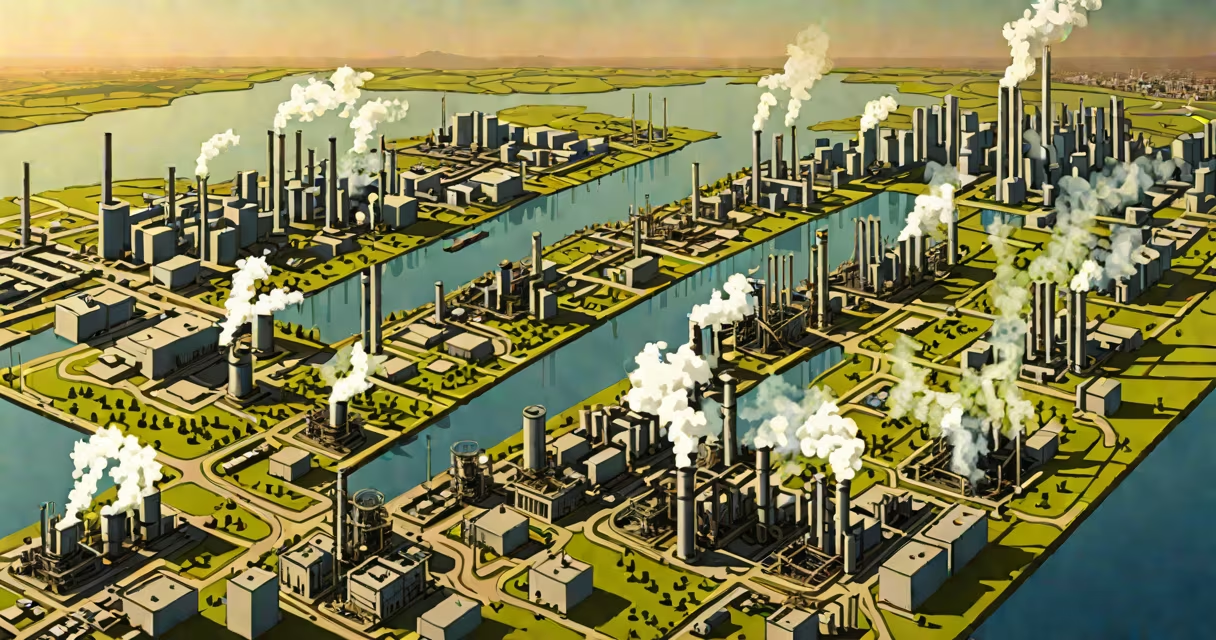
Areas of pollution are geographic locations where harmful substances accumulate due to human activity, degrading air, water, soil, or ecosystems. These zones often form around industrial sites, cities, highways, and intensive farmland where emissions and waste concentrate.
Contaminants enter these areas through direct discharge, atmospheric deposition, runoff, or leaching. Once present, pollutants persist in sediments, groundwater, or airborne particles, posing risks to health and biodiversity. The most common types include air, water, soil, and noise pollution, each affecting different regions based on land use and infrastructure.
For example, a river flowing through a mining district may carry heavy metals like lead and mercury downstream, contaminating drinking water supplies. Similarly, a metropolitan area with high vehicle density develops elevated ground-level ozone and particulate matter concentrations, especially during summer months.
Pollution accumulates in areas where sources are concentrated and dispersion mechanisms are limited. Urban heat islands, for instance, trap pollutants in stagnant air masses, increasing exposure. Industrial zones often lack adequate emission controls, allowing toxic chemicals to escape into nearby air and water systems.
Topography plays a role too. Valleys surrounded by mountains can trap cold air and pollutants, leading to persistent smog. The Los Angeles Basin experiences this phenomenon regularly, with inversion layers preventing vertical mixing of air pollutants.
Waste disposal practices also determine pollution hotspots. Landfills located near residential neighborhoods emit methane and leachate containing volatile organic compounds. When rainfall seeps through waste, it carries toxins into groundwater, spreading contamination beyond the original site.
Each environment hosts distinct pollution profiles based on dominant sources:
| Area Type | Primary Pollutants | Common Sources | Health & Environmental Impact |
|---|---|---|---|
| Urban Centers | PM2.5, NO₂, CO, benzene | Vehicles, power plants, construction | Respiratory illness, reduced visibility, climate feedback |
| Industrial Zones | Heavy metals, dioxins, sulfur dioxide | Factories, refineries, chemical plants | Birth defects, cancer clusters, system collapse |
| Agricultural Regions | Nitrates, pesticides, phosphorus | Fertilizer runoff, livestock waste | Algal blooms, dead zones in lakes, groundwater contamination |
| Rivers and Coastal Zones | Microplastics, oil, pathogens | Plastic waste, sewage, shipping spills | Marine life death, food chain disruption |
These patterns reflect global trends. A 2021 study by the World Health Organization found that 99% of the world's population breathes air exceeding safe PM2.5 levels, with the highest concentrations in South Asia and Sub-Saharan Africa.
People often assume pollution is only visible-smokestacks, oil slicks, or trash-filled streets. But many areas of pollution operate invisibly. Groundwater contamination from nitrate leaching in farming regions rarely shows surface signs until wells fail or children develop blue baby syndrome.
Another error is equating pollution with visible sources. A single factory may contribute less than regional transportation networks. In the U.S., road vehicles account for 54% of nitrogen oxide emissions, according to the Environmental Protection Agency (EPA), despite being less dramatic than smoke-belching factories.
Also, pollution doesn't stop at borders. The Great Pacific Garbage Patch-larger than Texas-is formed by debris carried by ocean currents from coastal cities worldwide. No single nation owns the source, yet the impact spans multiple countries.
The Ganges River in India flows through heavily populated and industrialized regions. Cities like Varanasi and Kanpur discharge untreated sewage and industrial effluents directly into the river. Over 100 million people rely on the Ganges for drinking water, bathing, and religious rituals.
Testing by the Central Pollution Control Board (CPCB) revealed fecal coliform levels 100 times above safe limits in stretches near Varanasi. Chemical oxygen demand (COD) readings exceeded 100 mg/L-indicating severe organic pollution. This makes the river unfit for consumption or irrigation.
Even though the Indian government launched the Namami Gange program in 2014, aiming to clean the river by 2024, progress remains slow. As of 2023, only 60% of planned sewage treatment plants were operational. Contamination persists in areas where enforcement is weak and monitoring inconsistent.
While often used interchangeably, pollution and contamination differ in scope. Pollution refers to the introduction of harmful substances into an environment. Contamination implies the presence of unwanted material, but not necessarily harm.
For example, a lake with high algal growth due to excess nitrogen is polluted. But if the same lake contains trace amounts of arsenic from natural bedrock, it's contaminated-but not necessarily polluted unless human activity increased the concentration.
This distinction matters in regulation. The EPA uses pollution thresholds to enforce clean air and water standards. Contamination levels below regulatory limits don't trigger legal action, even if they exist.
In 2019, I monitored air quality in a small town near a coal-fired power plant. Using a low-cost sensor network, we measured hourly PM2.5 levels. During winter mornings, readings spiked to 120 µg/m³-over four times the WHO safety threshold. Residents reported increased coughing and eye irritation. The local health department had no official data for that area, highlighting gaps in monitoring where pollution occurs but isn't tracked.
Identifying pollution hotspots enables targeted interventions. Cities can reroute traffic, install green barriers, or upgrade wastewater systems. Farmers can adopt buffer strips to reduce nutrient runoff. Governments can enforce zoning laws to separate residential zones from industrial facilities.
Knowing where pollution concentrates allows communities to advocate for cleaner policies. Data from satellite imagery and ground sensors now make it possible to map pollution in real time. The European Space Agency's Sentinel-5P satellite tracks nitrogen dioxide emissions globally, revealing patterns invisible to the naked eye.