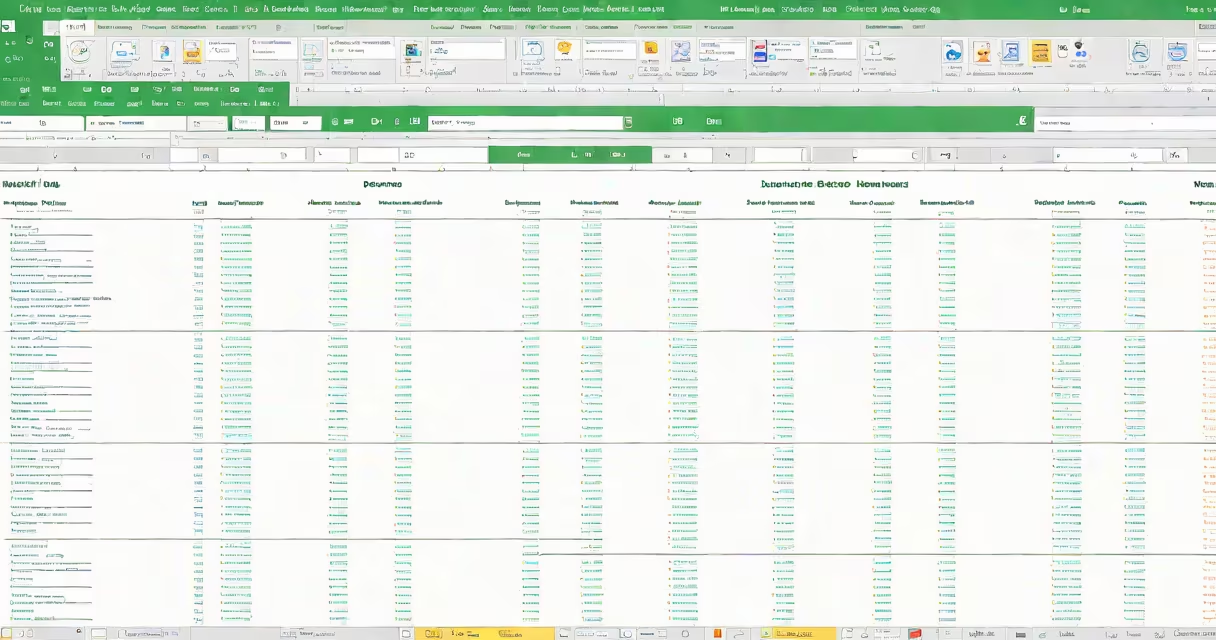
An Excel sheet basic is a digital workbook page composed of intersecting rows and columns where users enter, format, and manipulate data using formulas and functions. It serves as the foundational unit within Microsoft Excel for organizing information such as budgets, inventories, or schedules.
Each cell in the grid can hold numbers, text, dates, or formulas. The intersection of a row (numbered) and column (lettered) creates a unique address-like A1 or B5-used to reference data in calculations. This structure enables automatic updates when values change, making it ideal for changing data tracking.
For example, entering =SUM(B2:B10) in cell B11 automatically totals all values in cells B2 through B10. If any value in that range changes, the sum recalculates instantly. This responsiveness underpins Excel's widespread use in finance, logistics, and academic research.
Excel sheets operate on a coordinate system. Columns run vertically and are labeled alphabetically (A, B, C...), while rows extend horizontally and are numbered (1, 2, 3...). The combination of a letter and number identifies each cell.
When you input data, Excel stores it as raw content unless formatted. Formatting includes changing font size, color, alignment, or applying number formats like currency or percentage. These visual adjustments don't alter the underlying value but improve readability.
Formulas begin with an equals sign (=) and perform operations on cell references. For instance, =A1*B1 multiplies the contents of cell A1 by those in B1. Functions like SUM(), AVERAGE(), and IF() automate complex tasks. You can copy a formula across multiple cells, and Excel adjusts references relative to the new location-this behavior is called relative referencing.
Every Excel file contains one or more worksheets, each acting as a separate sheet basic. By default, a new workbook opens with three sheets named Sheet1, Sheet2, and Sheet3. Users can rename them (e.g., "Sales Q1" or "Inventory List") and add or remove sheets as needed.
| Type | Description | Use Case Example |
|---|---|---|
| Blank Sheet | Empty grid ready for manual entry | Creating a personal budget tracker |
| Template-Based | Pre-designed layout with sample data | Using a payroll template for employee hours |
| Imported Data | Loaded from CSV, database, or web source | Pulling daily sales figures from a retail API |
Sheet tabs appear at the bottom of the window. Clicking a tab switches between worksheets. Right-clicking a tab allows renaming, copying, or deleting the sheet. This feature supports modular project design-separating customer data from financial summaries, for instance.
Many assume Excel sheets are limited to numeric data. In reality, they handle text, dates, images, charts, and even hyperlinks. A single cell can contain a hyperlink to a website or another file, enabling quick navigation between documents.
Another frequent error is treating cell references as static. When you copy a formula like =A1+B1 from row 1 to row 2, Excel adjusts the references to =A2+B2 by default. This is relative referencing. To lock a reference-say, always using cell A1 regardless of where the formula moves-use dollar signs: =$A$1. This absolute reference prevents unintended shifts during copying.
Some users believe Excel cannot manage large datasets. While performance degrades beyond 1 million rows, modern versions handle up to 1,048,576 rows and 16,384 columns per sheet. For larger data, tools like Power Query or external databases integrate with Excel to extend capacity.
I once helped a small business owner track monthly expenses across six departments. They had spreadsheets scattered across folders, each with inconsistent formatting. I consolidated their data into one Excel sheet basic with standardized categories: Rent, Utilities, Salaries, Supplies, Marketing, and Miscellaneous.
Each department was assigned a column. Rows represented months. I applied conditional formatting to show overspending-cells turned red when costs exceeded 110% of the average. I added a summary row using =AVERAGE() and =MAX() to identify trends. After three months, they reduced unnecessary spending by 18% based on the insights.
This workflow relied solely on core features: cell addressing, basic formulas, and formatting. No macros or advanced scripting were involved. The solution worked because the structure matched the problem-simple, consistent, and scalable.
Excel sheet basic differs from Google Sheets in deployment model. While both support similar formulas and layouts, Excel runs locally and offers deeper integration with Windows applications like Access and PowerPoint. Google Sheets operates in the browser and excels at real-time collaboration.
It also contrasts with databases like SQL Server. Databases store structured data efficiently and enforce relationships between tables. Excel handles smaller datasets well but lacks constraints, indexing, or transaction control. For managing thousands of records with complex queries, a database is better suited.
Finally, Excel sheets aren't meant for long-term archival. Unlike PDFs or cloud storage systems, Excel files can corrupt if improperly closed. Always save backups. Use versioning-name files with dates like "Budget_2024_Q1_v2.xlsx"-to avoid confusion.
Understanding the excel sheet basic structure is essential for anyone working with data. analyzing sales, mastering this foundation unlocks efficiency and accuracy. Start with a clean sheet, define your purpose, and build step by step.