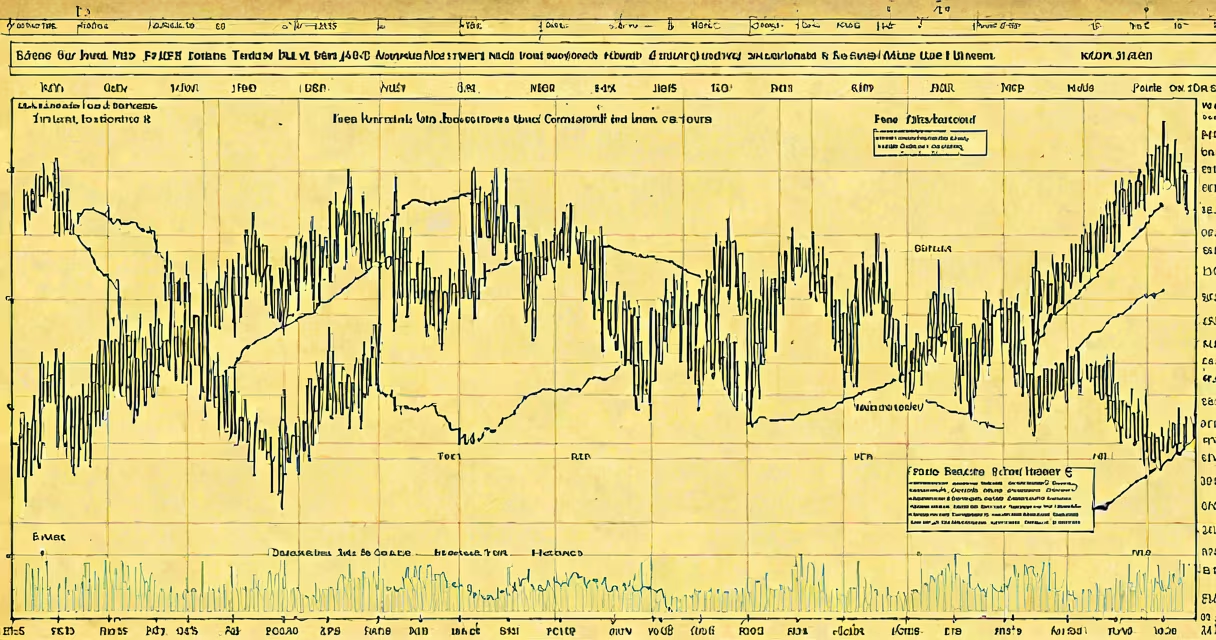
The sp500 total return tracks the performance of the S&P 500 index by including both price appreciation and reinvested dividends. It represents the actual return an investor would earn over time if they held the index and automatically reinvested all dividends.
This metric differs from the standard S&P 500 price return, which only accounts for changes in share prices. The total return includes the compounding effect of dividends, which historically have contributed about 40% of the S&P 500's long-term gains since 1950.
For example, if an investor bought $10,000 worth of an S&P 500 index fund in 1970, the price of the index rose from about 90 to over 4,800 by 2023. But the total return-factoring in reinvested dividends-grew the investment to approximately $180,000, not just $50,000 based on price alone.
Total return calculations assume dividends are paid out and immediately used to buy more shares at the current market price. This process compounds over time, accelerating growth beyond what price changes alone produce.
Each quarter, the S&P 500 index provider publishes a total return version of the index. These values are updated daily and available through financial data providers like Bloomberg, Reuters, and Morningstar. They reflect the cumulative effect of capital gains and dividend income.
Index funds and ETFs that track the S&P 500-such as the SPDR S&P 500 ETF (SPY)-report their total return performance using this same methodology. Investors who hold these funds through brokerage accounts see their account balances grow according to total return, not just price movement.
Two components drive total return: capital appreciation and dividend yield. Capital appreciation comes from the increase in the index's share price. Dividend yield is the annual income distributed by the companies in the index, expressed as a percentage of the current price.
Over the past 50 years, the average annual dividend yield for the S&P 500 has been around 2%. When combined with an average annual price gain of 6%, the total return averages about 8% per year. This aligns with historical data from the Federal Reserve Economic Data (FRED) and the S&P Dow Jones Indices.
| Time Period | Avg Annual Price Return | Avg Annual Dividend Yield | Estimated Total Return |
|---|---|---|---|
| 1970-1999 | 10.2% | 2.4% | 12.6% |
| 2000-2022 | 4.3% | 1.8% | 6.1% |
| 1950-2022 | 6.1% | 2.1% | 8.2% |
Source: S&P Dow Jones Indices, FRED database (Federal Reserve Economic Data).
Price-only returns misrepresent long-term investment outcomes. A stock may rise 20% in a year, but if it pays a 3% dividend, the total return is 23%. Ignoring dividends understates actual gains.
For retirement planning, portfolio modeling, and asset allocation, total return is the gold standard. It reflects how much money an investor actually accumulates. According to Vanguard's research, investors who reinvest dividends consistently achieve higher compound growth than those who spend or hold them as cash.
Many people mistake the S&P 500's headline price return-often reported in news outlets-as the full story. But the total return, which includes reinvested dividends, tells the real performance history. For example, the S&P 500 price return from 2000 to 2022 was negative due to the dot-com crash and the 2008 financial crisis. Yet the total return was positive at 6.1% annually because dividends kept compounding during downturns.
One widespread error is assuming that "total return" means "net of fees." It does not. Total return refers to the underlying asset's performance, not the investor's net return after taxes, trading costs, or management fees. An investor holding an S&P 500 ETF may see lower personal returns due to expense ratios or tax events.
Another confusion arises between total return and compound annual growth rate (CAGR). While CAGR expresses average annual growth over a period, total return is the cumulative gain. For instance, the S&P 500 total return from 1950 to 2022 was 32,000% over 72 years, which translates to a CAGR of 8.2%.
Investors often overlook how much dividends contribute. From 1950 to 2022, about 40% of the S&P 500's total return came from reinvested dividends. This is not intuitive-most people focus on price movements-but it's a critical factor in long-term wealth building.
In January 1970, the S&P 500 closed at 90.14. By December 2022, the price had risen to 4,766.33-a 4,180% price gain. However, the total return, including reinvested dividends, was 1,790% compounded annually.
An initial $10,000 investment in an S&P 500 index fund in 1970 would have grown to $180,000 by 2022, not $418,000. The difference comes entirely from dividends being reinvested. Without reinvestment, the return would have been far lower.
During that span, the S&P 500 paid out over $1.2 trillion in dividends. Reinvesting those payments allowed the investor to buy more shares at lower prices during market dips, amplifying gains during recovery periods.
Financial websites such as Yahoo Finance, Bloomberg, and Morningstar provide historical total return data for the S&P 500. Look for the "Total Return" column in index performance tables, not just "Price Return" or "Net Asset Value."
For institutional and academic use, the S&P Dow Jones Indices website offers detailed datasets, including total return indices like the S&P 500 Total Return Index (ticker: ^SPTR).
When evaluating investment strategies, compare total return figures across time periods. For example, the 10-year total return from 2013 to 2022 was 10.6% annually, higher than the 3.2% price return alone.
The sp500 total return is the most accurate measure of long-term market performance. It combines price gains with the power of reinvested dividends. Ignoring it leads to underestimating real investment results.
Understanding this concept helps investors avoid common pitfalls, such as judging a fund's success solely by its price chart. It also highlights the importance of choosing investments that automatically reinvest dividends, such as low-cost index funds or ETFs.