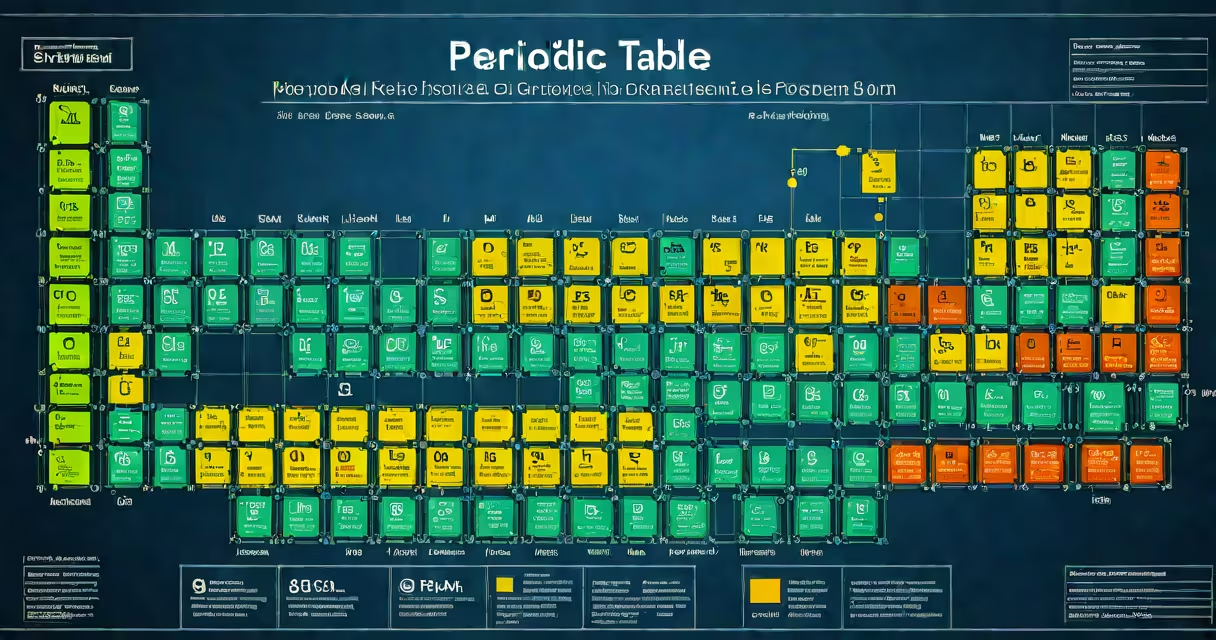
A periodic table PowerPoint presentation is a digital slide deck that organizes chemical elements by atomic number, electron configuration, and recurring chemical properties. It serves as a visual aid in classrooms, labs, and science lectures to teach elemental relationships, periodic trends, and bonding behavior.
Each slide typically displays the element's symbol, atomic number, atomic mass, and group/period location. Animations show trends such as increasing electronegativity across a period or decreasing ionization energy down a group. Presentations may include embedded videos, clickable element cards, or quizzes to reinforce learning.
Teachers use these decks to structure lessons on topics like metal reactivity, noble gas stability, or transition metal oxidation states. Students access them for review, project work, or exam prep. A well-designed version includes color-coded groups (alkali metals, halogens, lanthanides) and real-world applications-such as lithium in batteries or iodine in thyroid function.
PowerPoint presentations use slide transitions, animations, and hyperlinks to guide attention through complex data. The periodic table's layout-rows (periods) and columns (groups)-maps directly onto the slide grid. For example, a slide showing Period 2 might animate from left to right, highlighting lithium, beryllium, boron, carbon, nitrogen, oxygen, fluorine, and neon.
Clickable elements allow users to explore details. Clicking "Na" (sodium) might trigger a pop-up with its electron configuration (1s² 2s² 2p⁶ 3s¹), melting point (97.8°C), and reaction with water. Embedded audio clips can play the pronunciation of element names, aiding ESL learners.
Presentations can sync with classroom response systems. After displaying "Which element has the highest electronegativity?" students vote via tablets. The correct answer-fluorine-is then highlighted with a sound effect and a brief explanation.
Effective periodic table presentations follow a consistent structure:
| Type | Use Case | Key Features |
|---|---|---|
| Introductory | Grades 6-9 | Large fonts, emoji for elements (e.g., 🌡️ for mercury), basic group colors |
| Advanced | High school AP Chemistry, college | Atomic radius graphs, ionization energy charts, orbital diagrams |
| Interactive | Classroom tech labs, online courses | Hyperlinked elements, drag-and-drop matching games, embedded simulations |
| Thematic | Special units: "Elements in Medicine," "Metals in Space" | Images of MRI machines using gadolinium, spacecraft using titanium alloys |
Some educators build custom templates using Microsoft's Designer or Google Slides' AI tools. These auto-format based on selected themes-like "science fiction" or "earth's crust abundance"-and pull live data from the IUPAC database.
For example, a presentation titled "The Elements That Built Us" uses a timeline layout. Slide 1 shows hydrogen and helium from the Big Bang. Slide 10 displays calcium and iron in human bones and blood. Each slide cites sources like the Royal Society of Chemistry's Elementymology & Elements, ensuring accuracy.
Many assume the periodic table is static. In reality, new elements are added periodically. The most recent additions-nihonium (113), moscovium (115), tennessine (117), and oganesson (118)-were confirmed by the International Union of Pure and Applied Chemistry (IUPAC) in 2016. A current presentation must reflect these updates.
Another error: treating groups as purely physical categories. Group 1 (alkali metals) are reactive, yes-but their reactivity increases down the group due to lower ionization energy, not because they're "more metallic." A slide showing sodium reacting violently with water while lithium barely fizzes illustrates this trend.
Some presentations mislabel element classifications. For example, placing aluminum in the "transition metals" column is incorrect. Aluminum is a post-transition metal, located in Group 13. This mistake confuses students about electron configuration patterns. Correct labeling ensures accurate understanding of valence electrons and bonding behavior.
In a high school chemistry class in Portland, Oregon, a teacher used a 22-slide periodic table PowerPoint to introduce the concept of periodic trends. The deck included:
One student, who struggled with electron configurations, reported that the color-coded orbitals helped visualize the 4s before 3d filling order. "Seeing the s-orbital fill first made sense," he said. "I finally got why chromium is [Ar] 4s¹ 3d⁵, not 4s² 3d⁴."
Designers should prioritize clarity over decoration. According to the National Science Teaching Association (NSTA), visuals should reduce cognitive load. Avoid cluttered layouts, excessive animations, or distracting backgrounds. Use legible fonts (e.g., Calibri, Arial) and high-contrast colors.
Accuracy is critical. The IUPAC maintains the official list of elements and their standard atomic weights. As of 2023, the values are updated every five years. Presentations citing outdated masses-like lead's atomic weight as 207.2 instead of 207.2(1)-risk misleading students.
For example, a presentation claiming "oxygen has a mass of 16" is incomplete. The correct statement is "oxygen has a standard atomic weight of 15.999 u." Using precise terminology avoids confusion between atomic mass and molar mass.
When creating a presentation, reference trusted sources. The Royal Society of Chemistry's Chemistry World offers free downloadable templates. The American Chemical Society (ACS) provides peer-reviewed lesson plans aligned with NGSS standards. Both organizations emphasize evidence-based content and accessibility.
Always test the file on different devices. A presentation that works on a desktop may fail on a tablet due to missing fonts or corrupted animations. Export as PDF or PPTX format for reliability.
Periodic table PowerPoint presentations are not just static images. They are changing tools that organize scientific knowledge, support inquiry, and make abstract concepts visible. When designed with care, they become essential resources in science education.