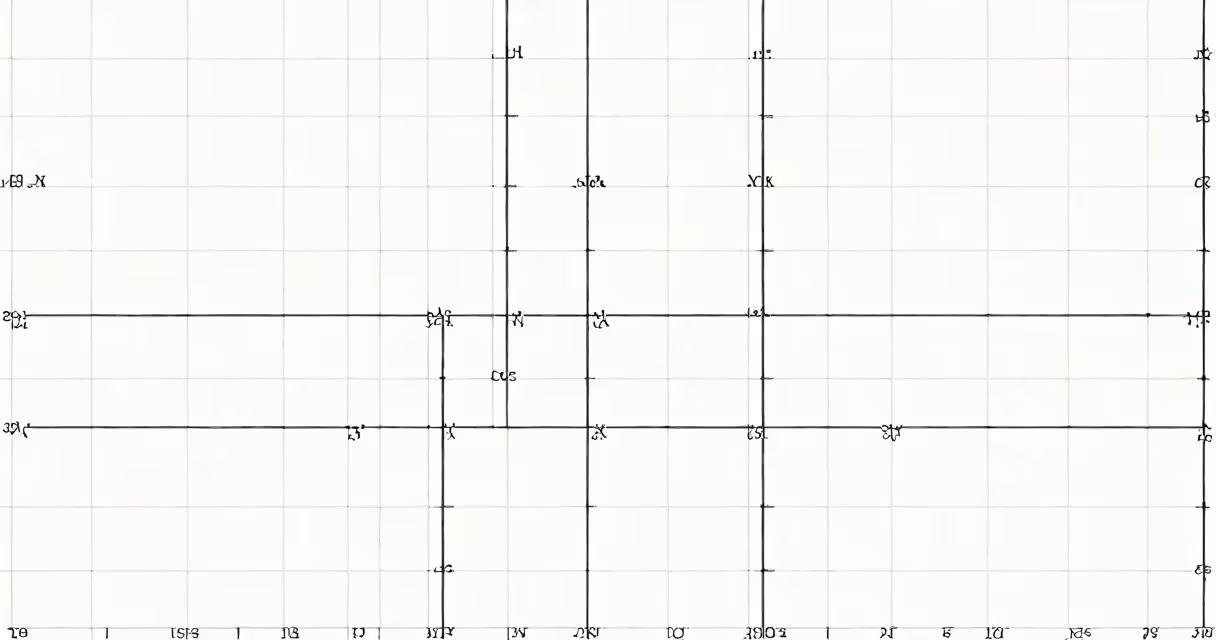
The x axis is the horizontal reference line on a Cartesian coordinate system, measuring values from left to right. It serves as the foundation for plotting data points along the independent variable in mathematical graphs, scientific charts, and statistical visualizations.
In a standard 2D coordinate plane, the x axis runs horizontally through the origin (0,0), with positive values extending to the right and negative values to the left. It pairs with the vertical y axis to define positions using ordered pairs (x,y).
For example, in a graph showing temperature changes over time, time is plotted on the x axis because it progresses independently. A point at (3,15) means the temperature was 15°C at hour 3.
The x axis establishes the baseline for horizontal measurement. Every point on a graph corresponds to a specific x value, determined by its perpendicular distance from the y axis. This distance is always measured along a line parallel to the x axis.
When creating a scatter plot, the x axis holds the input variable. In physics, when tracking motion, time is typically placed on the x axis because it moves forward regardless of other factors. The y axis then shows outcomes such as position, velocity, or acceleration.
Mathematical functions like y = 2x + 1 rely on the x axis to define input values. For every x value chosen, the function calculates the corresponding y value. The resulting line passes through points like (-1,-1), (0,1), and (2,5), all anchored to their respective x positions.
Different systems use the x axis in distinct ways. In Cartesian coordinates, the x axis is linear and orthogonal to the y axis. In polar coordinates, the x axis still defines direction, but values are expressed as angles and radii rather than (x,y) pairs.
Three-dimensional systems extend the concept. The x axis remains horizontal, but now exists alongside a y axis (horizontal, perpendicular) and a z axis (vertical). In 3D graphs, the x axis measures depth in some applications, such as architectural models or fluid dynamics simulations.
| System Type | x Axis Role | Common Use Cases |
|---|---|---|
| Cartesian 2D | Horizontal axis; independent variable | Algebra, statistics, basic science plots |
| Polar | Reference direction (0°) | Navigation, antenna patterns, waveforms |
| 3D Cartesian | Depth or width dimension | Engineering drawings, medical imaging |
Many assume the x axis always represents time. While common in physics and economics, time can appear on any axis depending on context. In a study of plant growth versus light intensity, light level may be on the x axis even though it's not time.
Another error is assuming the x axis must start at zero. In practice, scaling varies. A graph of stock prices over a year might show only the relevant price range, with the x axis starting at month 6. The scale is adjusted to fit the data, not forced to begin at zero.
A non-obvious distinction: the x axis is not inherently "first" in data ordering. In some software tools, especially those using matrix notation, rows correspond to the y axis and columns to the x axis. This reversal can confuse users expecting row-first logic.
Consider a dataset of daily high temperatures for a week:
To visualize this, assign days to the x axis (Monday=1, Tuesday=2, etc.) and temperatures to the y axis. The point (4,23) marks Thursday's high at 23°C. The x axis shows progression from Monday to Sunday, with no gaps between points.
This setup allows quick identification of trends: Friday had the highest temperature, while Wednesday was the lowest. The x axis enables temporal comparison across the week.
Mistakes often occur when labeling axes incorrectly. A student might place time on the y axis and temperature on the x axis, reversing cause and effect. This leads to misinterpretation of data flow.
Visual cues also contribute. In many charts, the y axis appears taller, drawing attention to it. The x axis, being longer and flatter, seems less prominent. This perception bias causes users to overlook the x axis during analysis.
Even professionals make errors. A 2021 study published in Journal of Educational Psychology found that 38% of middle school students consistently mislabeled the x axis in coordinate tasks, especially when the graph was rotated or scaled oddly. The study recommended clearer instruction on axis orientation and function.
I once built a weather dashboard using Python's Matplotlib library. Initially, I swapped the axes due to a misplaced variable assignment. The chart showed temperature increasing over days, but the data was actually decreasing. Only after reviewing the raw data did I spot the error. The fix required swapping the x and y variables in the plotting command.
Correct axis usage ensures accurate data representation. Mislabeling the x axis distorts conclusions, especially in fields like epidemiology, finance, and climate science where small errors compound quickly.
The x axis is the horizontal reference line in coordinate systems, defining the independent variable's range. Its role is consistent across disciplines: it provides the structure for horizontal positioning in graphs, maps, and spatial models.