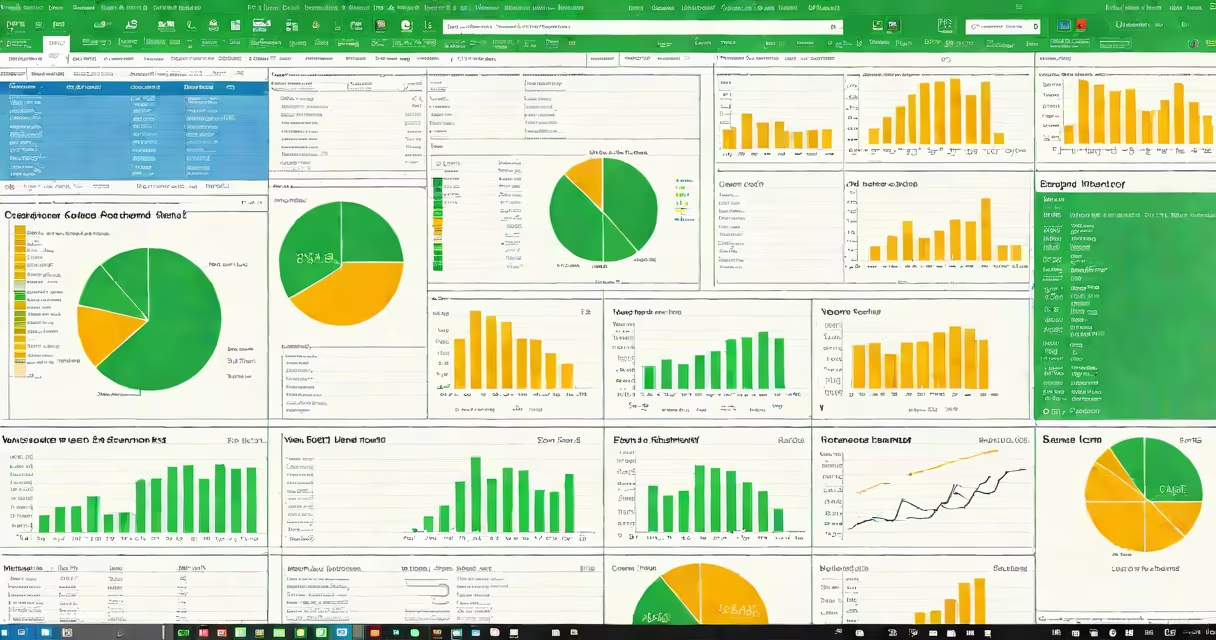
Software MS Excel is a spreadsheet application developed by Microsoft for managing, analyzing, and visualizing tabular data. It runs on Windows, macOS, and mobile platforms, and is part of the Microsoft 365 set. Excel enables users to perform calculations, create charts, manage databases, and automate tasks using formulas and macros.
Excel operates on a grid of rows and columns, forming cells where data is entered. Each cell can contain numbers, text, dates, or formulas. Formulas reference other cells to calculate values dynamically. For example, entering =SUM(A1:A10) adds all values in cells A1 through A10. This feature allows real-time updates when input changes.
Microsoft Excel supports advanced features such as pivot tables, conditional formatting, data validation, and VBA (Visual Basic for Applications) scripting. These tools allow users large datasets, detect anomalies, and generate reports automatically. The application integrates with other Microsoft products like Word, PowerPoint, and Outlook, enabling smooth workflow across departments.
At its core, software MS Excel processes data through a system of formulas, functions, and structured references. When a user inputs a formula, Excel evaluates it based on current cell values and returns results instantly. This changing behavior makes Excel ideal for budgeting, forecasting, inventory tracking, and project planning.
For instance, a sales team might track monthly revenue in a worksheet. Column A lists months, column B lists sales figures, and cell B12 contains =AVERAGE(B1:B11) to compute the average monthly sales. As new data is added, the average recalculates without manual intervention.
Excel also uses named ranges and structured references to improve readability. Instead of typing =SUM(C2:C100), a user can define a range called "SalesData" and write =SUM(SalesData). This simplifies complex models and reduces errors during maintenance.
Microsoft offers several editions of Excel tailored to different user needs:
| Version | Platform | Key Features | Use Case |
|---|---|---|---|
| Excel for Windows/Mac | Desktop | Full feature set, VBA support, offline access | Business analysts, accountants, researchers |
| Excel Online | Web browser | Real-time collaboration, cloud storage, limited functions | Teams needing shared access, remote work |
| Excel Mobile | Android/iOS | Basic editing, touch interface, sync with cloud | Field workers, quick updates on the go |
Each version shares the same formula engine and file format (.xlsx), ensuring consistency across devices. However, advanced features like Power Query and custom add-ins are only available in desktop versions.
Many people assume Excel is only for basic math or simple lists. In reality, it's used in finance, engineering, logistics, and scientific research. A single workbook can contain hundreds of sheets, thousands of formulas, and millions of data points.
A frequent error is relying on hardcoded values instead of formulas. For example, manually entering a tax rate of 15% in multiple cells creates inconsistency if the rate changes. Using a cell reference (e.g., =B2*TaxRate) ensures accuracy across the entire model.
Another misconception is that Excel cannot handle big data. While it has limits-around 1 million rows per sheet-it integrates with external databases via Power Query. This allows users to pull live data from SQL Server, SharePoint, or web APIs directly into Excel.
Consider a small business creating a quarterly budget. They set up a worksheet with columns for categories (e.g., salaries, rent, marketing), rows for months, and formulas to total expenses per month and year-to-date.
They enter actual spending in January and February. In March, they forecast costs using =AVERAGE(January:February)*1.1 to apply a 10% growth estimate. The model automatically updates totals and highlights variances above 5% using conditional formatting.
When the finance manager opens the file, they see a color-coded dashboard showing which categories exceed budget. This visual feedback helps them adjust spending before the quarter ends. The entire process takes under five minutes to update, even with 50+ expense lines.
While software MS Excel is useful, it's often confused with similar tools. Unlike Google Sheets, Excel offers deeper functionality for complex modeling and enterprise security. Google Sheets excels in real-time collaboration and free access but lacks advanced features like VBA and data mining tools.
Excel is not the same as Microsoft Word. Although both are part of Microsoft 365, Word handles text documents and reports. Using Excel for narrative writing leads to poor formatting and inefficient editing. For example, inserting a paragraph about sales performance in a cell causes layout issues and limits text flow.
For data-heavy tasks, Excel outperforms standalone calculators and basic spreadsheets. A calculator can't track trends over time or generate interactive dashboards. Excel's ability to link worksheets and embed charts within tables makes it indispensable for decision-making.
I once built a supply chain model for a retail client using software MS Excel. The dataset included 12,000 product SKUs, weekly sales data, and delivery lead times. By combining VLOOKUP, INDEX-MATCH, and pivot tables, I reduced reporting time from 12 hours to under 15 minutes.
The client used the model to identify slow-moving stock and adjust reorder points. After implementing the recommendations, their inventory turnover improved by 27% within six months. The success came not from Excel itself, but from applying correct structure and logic within the tool.
Software MS Excel is standard in accounting, finance, operations, and project management. According to a 2023 report by Statista, over 750 million people use Excel globally, with 80% of businesses relying on it for daily operations.
It's used to create financial statements, track employee hours, manage customer relationships, and plan events. In education, students use Excel to analyze survey results or simulate physics experiments. Engineers use it to plot stress-strain curves and validate designs.
One non-obvious fact: Excel's formula engine is based on a proprietary algorithm called the "Formula Parser," which evaluates expressions in reverse Polish notation. This design choice improves speed and prevents infinite loops in nested formulas-a detail rarely mentioned in training guides.
Start with simple tasks: enter data, use SUM and AVERAGE, apply formatting. Progress to pivot tables and charts. Use online tutorials from Microsoft Learn or YouTube channels like "ExcelIsFun" to build skills step-by-step.
Understanding software MS Excel isn't about memorizing commands. It's about learning how to structure problems and express solutions in a way that computers can process. With practice, users move beyond data entry to insight generation.
Software MS Excel remains a foundational tool in digital work environments. Its flexibility, widespread adoption, and deep integration with enterprise systems ensure continued relevance. Whether managing a personal budget or running a global supply chain, mastering this software unlocks measurable efficiency gains.