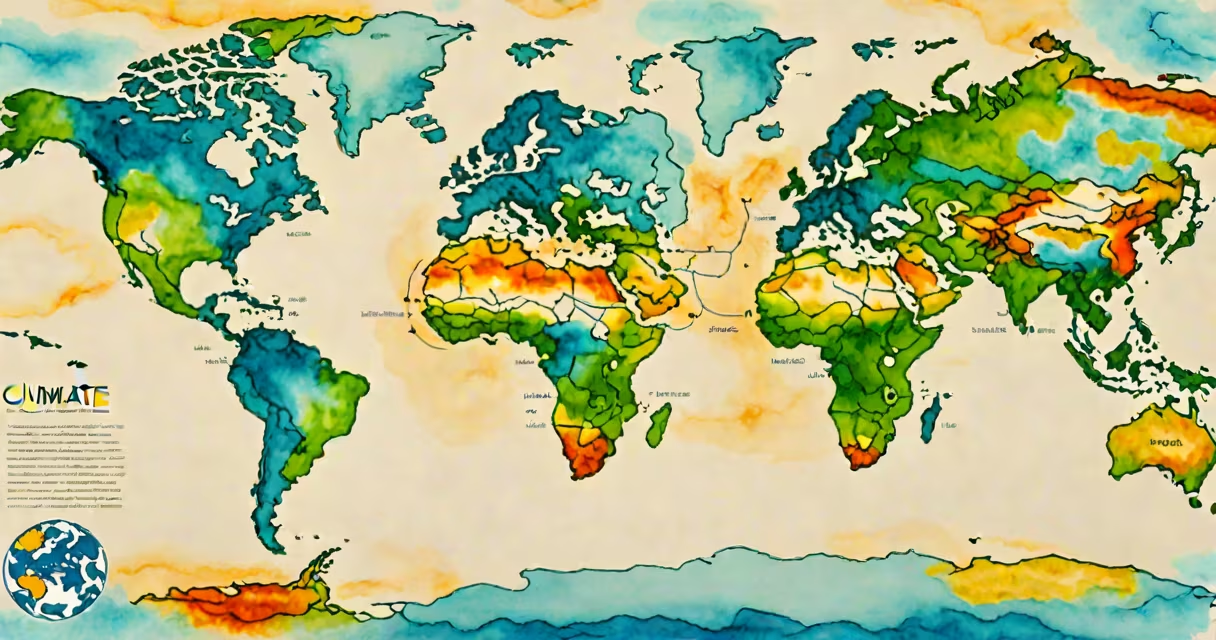
Climate refers to the long-term average of weather conditions-temperature, precipitation, humidity, wind, and atmospheric pressure-observed over periods of 30 years or more in a specific region. It is not the same as daily weather, which fluctuates hourly or daily.
While weather describes what happens in the atmosphere today or this week, climate measures consistent patterns over decades. For example, a desert region may have hot days and cool nights year-round, and that persistent heat defines its climate. Climate data informs agriculture, urban planning, and disaster preparedness.
The World Meteorological Organization (WMO) sets the standard for climate reference periods at 30 years, based on historical records. This ensures consistency when comparing regions or tracking changes over time. The WMO also maintains global databases of climate observations, including sea surface temperatures and atmospheric CO₂ levels.
Scientists collect climate data from instruments like thermometers, rain gauges, satellites, and ocean buoys. These measurements are compiled into climate normals-averages for 30-year spans such as 1961-1990 or 1991-2020. These normals serve as baselines for detecting anomalies.
Climate models simulate Earth's systems using physics-based equations. They account for solar radiation, greenhouse gas concentrations, ocean currents, and land surface properties. Models run on supercomputers to project future climate scenarios under different emissions pathways. The Intergovernmental Panel on Climate Change (IPCC) uses these models to assess risks and inform policy.
A key distinction is that climate models do not predict specific weather events. Instead, they estimate probabilities-for example, that a region will see more frequent droughts or heavier rainfall seasons by 2050. These projections support adaptation strategies in water management, infrastructure design, and public health.
Climate classifications group regions by dominant temperature and precipitation patterns. The most widely used system is the Köppen-Geiger classification, which divides Earth into five major climate groups:
| Climate Type | Key Features | Example Regions |
|---|---|---|
| Tropical (Af, Am, Aw) | High temperatures year-round; wet season with heavy rains | Amazon Basin, Congo Rainforest, parts of Southeast Asia |
| Temperate (Cfa, Cfb, Csa) | Mild winters; warm summers; seasonal rainfall | Western Europe, Pacific Northwest (USA), central China |
| Desert (BWh, BWk) | Limited precipitation; high daytime temperatures; large diurnal swings | Sahara Desert, Sonoran Desert, Australian Outback |
| Steppe (BSk, BSh) | Low rainfall; semi-arid; prone to droughts | Great Plains (USA), Central Asia, parts of southern Africa |
| Polar (ET, EF) | Perpetual snow and ice; cold temperatures year-round | Antarctica, Arctic Circle, Greenland |
Each zone supports unique ecosystems. Tropical climates host dense forests; polar climates sustain tundra and ice-dependent species. Shifts in climate boundaries due to global warming are already altering species ranges and agricultural zones.
Many people confuse climate with weather. A cold winter day does not disprove global warming. Climate is about long-term trends, not single events. A 2023 study published in Nature Climate Change found that 68% of Americans incorrectly equated extreme cold spells with evidence against climate change.
Another misconception is that climate change means colder temperatures. In reality, global warming increases average temperatures worldwide. Since 1880, Earth's average surface temperature has risen by 1.2°C (2.2°F), according to NASA's Goddard Institute for Space Studies. This rise drives more intense heatwaves, stronger storms, and faster glacial melt.
Climate is not a single variable-it's a composite of multiple factors. For example, a region can have a Mediterranean climate (hot dry summers, mild wet winters) even if annual rainfall totals are low. The timing and distribution of precipitation matter as much as the quantity.
California's climate has shifted since the 1950s. Historical data shows a 20% decline in snowpack in the Sierra Nevada mountains between 1950 and 2020. Snowpack acts as a natural reservoir, releasing water slowly during spring and summer. Reduced snowpack threatens water supplies for cities and farms.
At the same time, fire seasons have lengthened. From 1970 to 2020, the average number of days with extreme fire risk increased by 35%. This aligns with rising temperatures and earlier snowmelt, drying out vegetation faster. The 2020 wildfire season burned over 4 million acres-more than double the previous record.
These changes are not random. They reflect long-term shifts in climate patterns. Scientists attribute the trend to rising greenhouse gas emissions, particularly carbon dioxide from fossil fuel combustion. The IPCC's Sixth Assessment Report confirms that human influence is "unequivocal" in driving recent climate change.
Climate data guides decisions across sectors. Cities use climate projections to design flood defenses. Farmers select crop varieties suited to projected growing seasons. Insurance companies adjust premiums based on modeled risk of hurricanes or wildfires.
For example, Miami Beach is elevating roads and installing pumps to combat sea level rise. Sea levels have risen 20 cm (8 inches) since 1900, with acceleration since 2000. Without intervention, projections suggest 30-50 cm of additional rise by 2100, increasing flooding frequency during king tides.
Understanding climate also helps individuals make informed choices. Reducing meat consumption lowers carbon footprints, as livestock production contributes 14.5% of global greenhouse gas emissions, according to the UN Food and Agriculture Organization. Choosing energy-efficient appliances reduces electricity demand, lowering reliance on fossil fuels.
Climate is not a single event or a temporary condition. It is a measurable, evolving pattern shaped by natural cycles and human actions. Recognizing this difference enables better responses to environmental challenges.
When discussing climate, avoid conflating it with weather or assuming that short-term fluctuations reflect long-term trends. Use verified data from institutions like the National Oceanic and Atmospheric Administration (NOAA) or the IPCC. Always distinguish between observed changes and projections.